Selasa, 06 Desember 2011

KORELASI DAN REGRESI

REGRESI GANDA

I.      Pengertian Regresi Ganda

Regresi ganda adalah regresi suatu variable terikat yang memiliki  lebih dari satu variable bebas. Bentuk persamaan umum dari regresi ganda adalah :
 

Regresi ganda berguna untuk mencari pengaruh dua variable predictor atau untuk mencari hubungan fungsional dua variable penjelas (variable bebas) atau lebih terhadap variable respon(variable terikat). Penyelesaian regresi ganda dapat menggunakan notasi matriks dan persamaan linear dengan metode substitusi dan eliminasi.

II.         Metode Regresi Ganda

a.     Metode Matriks

Dalam notasi matriks, p merupakan variable bebas berdasarkan jumlah pengamatan (n):

Dengan
Y = vector variable terikat berukuran nX1
X = matriks variable bebas berukuran n X (p+1)
 QUOTE    = vector koefisien regresi berukuran (p+1) X 1
 QUOTE   = vector galat berukuran nX1


Pendugaan koefisien regresi di buat dengan cara mendapatkan solusi atas persamaan normal yaitu


Sehingga

Selanjutnya ragan bagi  QUOTE   , s2{b}, dalam notasi matriks dituliskan sebagai :


dengan


Sehingga uji hpotesis atas H0 : bk ¹ 0 ; k = 0, 1, 2, 3, …….., p
Dapat di buat dengan criteria uji T.  Tolak H0 jika t  lebih kecil atau sama dengan -ta/2,n-(p+1) atau sama dengan -ta/2,n-p dengan                     , P(T ³ -ta/2,n-(p+1)) = a/2, dan
Pendugaan Nilai Peubah Respon galat baku bagi dugaan nilai-tengah Y dan dugaan nilai Y pada X tertentu, Xt’ dalam bentuk matriks masing-masing adalah :


Selang kepercayaan (1-a) 100% bagi nilai tengah Y dan dugaan nilai Y pada X tertentu ,  masing-masing adalah:


Jumlah kuadrat total, jumlah kuadrat regresi dan jumlah kuadrat galat dalam matriks ditulis masing-masing sebagai berikut:


Derajat bebas yang berpadanan dengan masing-masing jumlah kuadrat tersebut adalah :


Koefisien determinasi yang merupakan ukuran kesesuaian model dapat dihitung yaitu:


b.     Metode Persamaan Linear

Persamaan regresi ganda dapat digunakan dalam perhitungan nilai Y untuk setiap perhitungan nilai X1dan X2. Perubahan nilai Y disebabkan oleh perubahan X1, ketika X2 konstan ataupun sebaliknya. Data pada table regresi, yang terdiri dari variable X1, X2, dan Y dapat di hitung dengan persamaan sebagai berikut:


 Persamaan regresi ganda dapat di uji dengan persamaan berikut ini:


Kemudian mencari Rhintung dengan rumus:


Setelah Rhintung  diperoleh maka kuadratkanlah Rhintung. Kemudian menghitung F sign hitung dengan rumus:


Contoh soal:
1.     Diberikan data sebagai berikut:
Y
X1
X2
23.3
5
13
24.5
6
14
27.2
8
17
27.1
9
17
24.1
7
14
23.4
5
13
24.3
6
14
24.1
7
14
27.2
9
17
27.3
8
17
27.4
8
17
27.3
9
17
24.3
6
14
23.4
5
13
24.1
7
14
27
9
17
23.5
5
13
24.3
6
14
27.3
8
17
23.7
7
14

Tentukan koefisien regresi X1, X2, dan Y dengan metode:
i)       Persamaan linear
hitung pula nilai determinasi korelasiberganda dan F sign hitung
ii)    Matriks
Penyelesaian:
Koefisien regresi X1, X2, dan Y
i)          Persamaan linear
Buat table sebagai berikut:       
No
Y
X1
X2
X1Y
X2Y
X1X2
(X1)2
(X2)2
Y2
1
23.3
5
13
116.5
302.9
65
25
169
542.89
2
24.5
6
14
147
343
84
36
196
600.25
3
27.2
8
17
217.6
462.4
136
64
289
739.84
4
27.1
9
17
243.9
460.7
153
81
289
734.41
5
24.1
7
14
168.7
337.4
98
49
196
580.81
6
23.4
5
13
117
304.2
65
25
169
547.56
7
24.3
6
14
145.8
340.2
84
36
196
590.49
8
24.1
7
14
168.7
337.4
98
49
196
580.81
9
27.2
9
17
244.8
462.4
153
81
289
739.84
10
27.3
8
17
218.4
464.1
136
64
289
745.29
11
27.4
8
17
219.2
465.8
136
64
289
750.76
12
27.3
9
17
245.7
464.1
153
81
289
745.29
13
24.3
6
14
145.8
340.2
84
36
196
590.49
14
23.4
5
13
117
304.2
65
25
169
547.56
15
24.1
7
14
168.7
337.4
98
49
196
580.81
16
27
9
17
243
459
153
81
289
729
17
23.5
5
13
117.5
305.5
65
25
169
552.25
18
24.3
6
14
145.8
340.2
84
36
196
590.49
19
27.3
8
17
218.4
464.1
136
64
289
745.29
20
23.7
7
14
165.9
331.8
98
49
196
561.69
∑
504.8
140
300
3575.4
7627
2144
1020
4556
12795.82
Rata2
25.24
7
15
178.77
381.35
107.2
51
227.8
639.791


Dengan mensubstitusikan nilai masing-masing yang tertera pada table ke dalam persamaan di atas, sehingga:
504.8 = 20a + 140 b1 + 300 b2                             ……………………………(1)
3575,4 = 140 a + 1020 b1 + 2144 b2                    ……..………………(2)
7627 = 300 a + 2144 b1 + 4556 b2             ………………………… (3)
Eliminasi a dari persamaan (1) dan (2). Persamaan 1 dikalikan dengan -7 dan persamaan 2 dikalikan dengan 1
20a + 140 b1 + 300 b2    = 504.8                          (x-7)
140 a + 1020 b1 + 2144 b2 = 3575,4                    (x1)
sehingga diperoleh:
           40 b1 + 44 b2 = 41.8                                             …………..(4)
•         Eliminasi a dari persamaan (1) dan (3)
            20a + 140 b1 + 300 b2 = 504.8                  (x-15)
                   300 a + 2144 b1 + 4556 b2 = 7627           (x1)
           Sehingga diperoleh :
           44 b1 + 56 b2  = 55                                               ……………(5)
•         Eliminasi persamaan (4) dan (5)
            40 b1 + 44 b2 = 41.8              (x-44)
           44 b1  + 56 b2  = 55                  (x40)
           Sehingga diperoleh b2 = 1.1868 dan b1  = 0.26
           Maka nilai a dapat dihitung dengan rumus:

           Maka a= 9.26
 

           Sehingga
                   Y = 9.26 - 0.26 X1 + 1.1868 X2                          
ii)           Matriks


Matriks di atas di inverskan


Sehingga diperoleh


Lalu dikalikan hasil invers diatas dengan X’Y


Menghasilkan


Y = 9.26 -0.26 X1 + 1.19 X2
Rounded Rectangle: Y = 9.26 -0.26 X1 + 1.19 X2Dari matriks tersebut, maka diperoleh:
               
           Untuk data tersebut, KTG = 0.017 maka:


Sehingga
1.     Untuk uji H0:bo = 0; H1:b1 ¹ 0;
t =
2.     Untuk H1:b = 0 ; H2: b ¹ 0,
t =
3.     Untuk H2: b = 0 ; H3: b ¹ 0,
t =
Dengan t0.025;17 = 2.110  maka dapat disimpulkan untuk ketiga uji masing-masing adalah tolak Ho
2.       Tentukan selang kepercayaan 95%bagi Yxt apabila X1 = 5 dan X2 = 14!
Jawab: Selang kepercayaan 95%
 

          = 24.5742 ± (2.110) (0.017) (1+0.3395)
          = 24.5262 atau 24.6222
3.     Untuk data pada soal sebelumnya, buatlah tabel analisa ragam untuk regresi Y dengan dua variabel bebas


= 54.668


Table analisis ragam untuk regresi Y pada dua peubah bebas X1 dan X2
sumber
Jumlah Kuadrat
Derajat Bebas
Kuadrat Tengah
F hitung
Regresi
54.386
2
27.193
1641.14
Galat
0.282
17
0.017

Total
54.668
19


Adapun F 0.025;17 = 3.59. dengan Fhitung jauh lebih besar dari F table, maka keputusan ujinya adalah tolak Ho.
4.     Tentukan koefisien determinasi untuk model regresi linear Y pada peubah bebas X1 dan X2!
Jawab:
Ø  Persamaan Linear
Persamaan regresi ganda dapat di uji dengan persamaan berikut ini:


           Sehingga diperoleh
                   ∑x1y = 41.8
                   ∑x2y = 55
                   ∑y2 = 54.668
Dari data tersebut juga dapat ditentukan nilai koefisien korelasi berganda yaitu dengan rumus:
 

sehingga R= 0.995207434
Ø  Matriks


                                                       = 0.994235 = 99.42%
5.     Tentukan nilai dari F hitung!
 

= 1765.08
dari data di atas, Ho dan Ha di tolak karena nilai F pada tabel adalah 3.59


Chapter 17 Sound Waves (1)

Sound waves are the most common example of longitudinal waves. They travel
through any material medium with a speed that depends on the properties of the
medium.
Sound waves are divided into three categories that cover different frequency
ranges. (1) Audible waves lie within the range of sensitivity of the human ear. They can
be generated in a variety of ways, such as by musical instruments, human voices, or
loudspeakers. (2) Infrasonic waves have frequencies below the audible range. Elephants
can use infrasonic waves to communicate with each other, even when separated by
many kilometers. (3) Ultrasonic waves have frequencies above the audible range. You
may have used a “silent” whistle to retrieve your dog. The ultrasonic sound it emits is
easily heard by dogs, although humans cannot detect it at all. Ultrasonic waves are also
used in medical imaging.

17.1 Speed of Sound Waves
  •   The speed of sound waves in a medium depends on the compressibility and density of the medium
  •   The speed of sound also depends on the temperature of the medium

Speed of Sound in Various Media
 

The speed of sound waves in a medium depends on the compressibility and density of the medium. If the medium is a liquid or a gas and has a bulk modulus B and density r, the speed of sound waves in that medium is

                  (17.1)

It is interesting to compare this expression with Equation 16.18 for the speed of transverse waves on a string, 
 In both cases, the wave speed depends on an elastic property of the 
medium—bulk modulus B or string tension T—and on an inertial property of the medium—r or µ. In fact, the speed of all mechanical waves follows an expression of the general form:

For longitudinal sound waves in a solid rod of material, for example, the speed of sound depends on Young’s modulus Y and the density (r). Table 17.1 provides the speed of sound in several different materials.
The speed of sound also depends on the temperature of the medium. For sound traveling through air, the relationship between wave speed and medium temperature is

where 331 m/s is the speed of sound in air at 0°C, and TC is the air temperature in degrees Celsius. Using this equation, one finds that at 20°C the speed of sound in air is approximately 343 m/s.


Answer: (c). Temperature. Although the speed of a wave is given by the product of its wavelength (a) and frequency (b), it is not affected by changes in either one. The amplitude (d) of a sound wave determines the size of the oscillations of elements of air but does not affect the speed of the wave through the air.

17.2 Periodic Sound Waves
§  pressure variations control what we hear
§  Include the  compression and rarefactions
§  As the piston oscillates sinusoidally, regions of compression and rarefaction are continuously set up
The distance between two successive compressions (or two successive rarefactions) equals the wavelength (l). As these regions travel through the tube, any small element of the medium moves with simple harmonic motion parallel to the direction of the wave. If s(x, t) is the position of a small element relative to its equilibrium position1 we can express this harmonic position function as

 (17.2)


where smax is the maximum position of the element relative to equilibrium. This is often called the displacement amplitude of the wave. The parameter k is the wave number and w is the angular frequency of the piston. Note that the displacement of the element is along x, in the direction of propagation of the sound wave, which means we are describing a longitudinal wave.
The variation in the gas pressure (DP) measured from the equilibrium value is also periodic. For the position function in Equation 17.2, DP is given by
            (17.3)
1 We use s(x, t) here instead of y(x, t) because the displacement of elements of the medium is not  perpendicular to the x direction.

where
the pressure amplitude DPmax—which is the maximum change in pressure from the equilibrium value—is given by
              (17.4)
Thus, we see that a sound wave may be considered as either a displacement wave or a pressure wave. A comparison of Equations 17.2 and 17.3 shows that the pressure wave is 90° out of phase with the displacement wave. Graphs of these functions are shown in Figure 17.3. Note that the pressure variation is a maximum when the displacement from equilibrium is zero, and the displacement from equilibrium is a maximum when the pressure variation is zero.
Figure 17.3 (a) Displacement
amplitude and (b) pressure
amplitude versus position for a
sinusoidal longitudinal wave.


(c). Because the bottom of the bottle is a rigid barrier, the displacement of elements of air at the bottom is zero. Because the pressure variation is a minimum or a maximum when the displacement is zero, and the pulse is moving downward, the pressure variation at the bottom is a maximum

17.3 Intensity of Periodic Sound Waves
The intensity of a wave, or the power per unit area is the rate at which the energy being transported by the wave transfers through a unit area A perpendicular to the direction of travel of the wave: 
 
Now consider a point source emitting sound waves equally in all directions. From everyday experience, we know that the intensity of sound decreases as we move farther from the source. We identify an imaginary sphere of radius r centered on the source. When a source emits sound equally in all directions, we describe the result as a spherical wave. The average power Pav emitted by the source must be distributed uniformly over this spherical surface of area 4pr2. Hence, the wave intensity at a distance r from the source is
This inverse-square law, which is reminiscent of the behavior of gravity in Chapter 13, states that the intensity decreases in proportion to the square of the distance from the source.

Sabtu, 03 Desember 2011

Chapter 18 : Superposition and Standing Wave (part II)


Standing waves can be set up in a tube of air, such as that inside an organ pipe, as the result of interference between longitudinal sound waves traveling in opposite directions. The phase relationship between the incident wave and the wave reflected from one end of the pipe depends on whether that end is open or closed. This relationship is analogous to the phase relationships between incident and reflected transverse waves at the end of a string when the end is either fixed or free to move.
In a pipe closed at one end, the closed end is a displacement node because the
wall at this end does not allow longitudinal motion of the air. As a result, at a closed end of a pipe, the reflected sound wave is 180° out of phase with the incident wave. Furthermore, because the pressure wave is 90° out of phase with the displacement wave, the closed end of an air column corresponds to a pressure antinode (that is, a point of maximum pressure variation).
            The open end of an air column is approximately a displacement antinode2 and a pressure node. With the boundary conditions of nodes or antinodes at the ends of the air column, we have a set of normal modes of oscillation, as we do for the string fixed at both ends. Thus, the air column has quantized frequencies. The first three normal modes of oscillation of a pipe open at both ends are shown in Figure 18.18a. Note that both ends are displacement antinodes (approximately). In the first normal mode, the standing wave extends between two adjacent antinodes, which is a distance of half a wavelength. Thus, the wavelength is twice the length of the pipe, and the fundamental frequency is .


As Figure 18.18a shows, the frequencies of the higher harmonics are 2f1, 3f1, . . . . Thus, we can say that
 
            Because all harmonics are present, and because the fundamental frequency is given by
the same ex ssion as that for a string, we can express the natural frequencies
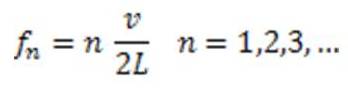
of oscillation as
If a pipe is closed at one end and open at the other, the closed end is a displacement node. In this case, the standing wave for the fundamental mode extends from an antinode to the adjacent node, which is one fourth of a wavelength. Hence, the wavelength for the first normal mode is 4L, and the fundamental frequency is .


As Figure 18.18b shows, the higher-frequency waves that satisfy our conditions are those that have a node at the closed end and an antinode at the open end; this means that the higher harmonics have frequencies  


In a pipe closed at one end, the natural frequencies of oscillation form a harmonic series that includes only odd integral multiples of the fundamental frequency. We express this result mathematically as

 
Musical instruments based on air columns are generally excited by resonance. The air column is presented with a sound wave that is rich in many frequencies. The air column then responds with a large-amplitude oscillation to the frequencies that match the quantized frequencies in its set of harmonics. In many woodwind instruments, the initial rich sound is provided by a vibrating reed. In the brasses, this excitation is provided by the sound coming from the vibration of the player’s lips. In a flute, the initial excitation comes from blowing over an edge at the mouthpiece of the instrument. This is similar to blowing across the opening of a bottle with a narrow neck. The sound of the air rushing across the edge has many frequencies, including one that sets the air cavity in the bottle into resonance.


Standing waves can also be set up in rods and membranes. A rod clamped in the middle and stroked parallel to the rod at one end oscillates, as depicted in Figure 18.20a. The oscillations of the elements of the rod are longitudinal, and so the broken lines in Figure 18.20 represent longitudinal displacements of various parts of the rod. For clarity, we have drawn them in the transverse direction, just as we did for air columns. The midpoint is a displacement node because it is fixed by the clamp, whereas the ends are displacement antinodes because they are free to oscillate. The oscillations in this setup are analogous to those in a pipe open at both ends. The broken lines in Figure 18.20a represent the first normal mode, for which the wavelength is 2L and the frequency is = v/2L
, where v is the speed of longitudinal waves in the rod. Other normal modes may be excited by clamping the rod at different points. For example, the second normal mode (Fig. 18.20b) is excited by clamping the rod a distance L/4 away from one end.
            Musical instruments that depend on standing waves in rods include triangles, marimbas, xylophones, glockenspiels, chimes, and vibraphones. Other devices that make sounds from bars include music boxes and wind chimes.
            Two-dimensional oscillations can be set up in a flexible membrane stretched over a circular hoop, such as that in a drumhead. As the membrane is struck at some point, waves that arrive at the fixed boundary are reflected many times. The resulting sound is not harmonic because the standing waves have frequencies that are not related by integer multiples. Without this relationship, the sound may be more correctly described as noise than as music. This is in contrast to the situation in wind and stringed instruments, which produce sounds that we describe as musical.
             Some possible normal modes of oscillation for a two-dimensional circular membrane
are shown in Figure 18.21. While nodes are points in one-dimensional standing waves on strings and in air columns, a two-dimensional oscillator has curves along which there is no displacement of the elements of the medium. The lowest normal mode, which has a frequency f1, contains only one nodal curve; this curve runs around the outer edge of the membrane. The other possible normal modes show additional nodal curves that are circles and straight lines across the diameter of the membrane.


Beating is the periodic variation in amplitude at a given point due  to the superposition of two waves having slightly different frequencies.
Formula of beat Frequencies is : 


•       The sound wave pattern produces by yhe majority of musical
•       In fact we can represent any periodic funcition as a series of sine and cosine terms by using mathematical techniques based on Fourier’s Theorem
•       The corresponding sum of terms that represents the periodic wave pattern is called Faurier’s series 


QUIZ :

EXAMPLE :